
Everything I argue on this site comes from the figures below.
Route submissions and rejections
The route and record figures cover 7,225 published routes and 21,854 records as they stood in March 2026, and the timing figures cover 1,173 submission decisions taken between October 2025 and June 2026.
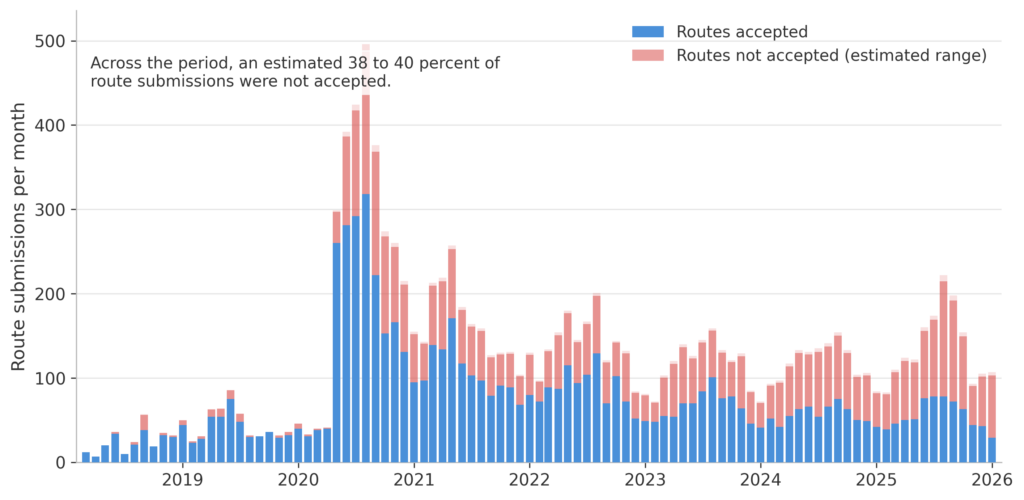
Route submissions by month since 2018, stacked, with the blue portion counting routes that were accepted and published and the red portion carrying my estimate for those that were not. Across the whole period an estimated 38 to 40 percent of submissions were not accepted. In the busiest month of 2020 the platform handled close to 500 submissions and published roughly two thirds of them, and the pattern holds through the quieter years that follow, with a red block of comparable proportion sitting on almost every month and none of it visible anywhere on the site.
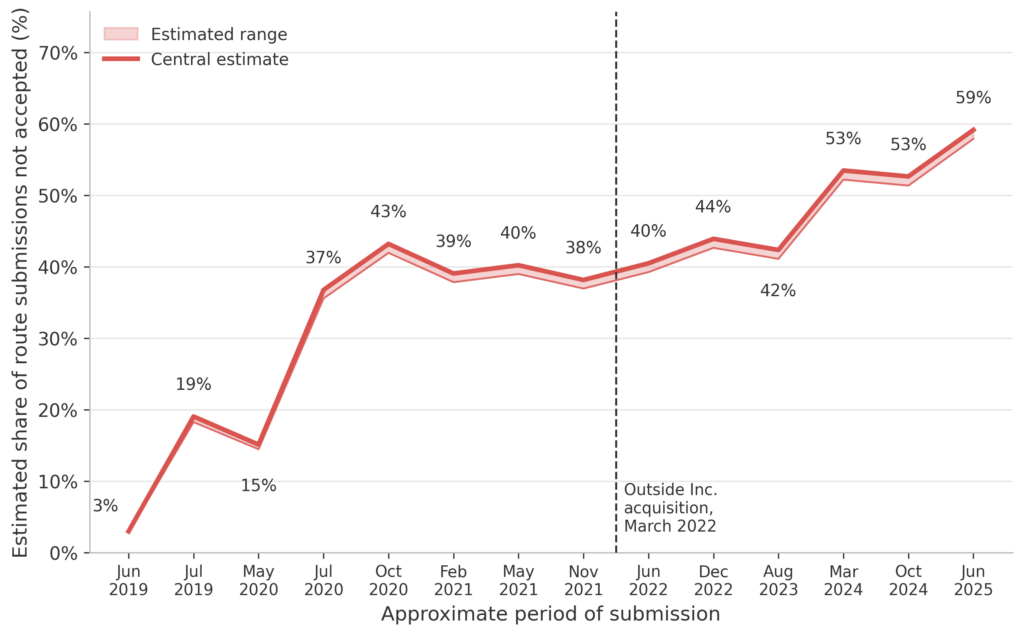
My estimate of the share of route submissions that did not result in a published route, by approximate period of submission, with the solid line the central estimate, the shaded band the estimated range.
Minimum route acceptance criteria
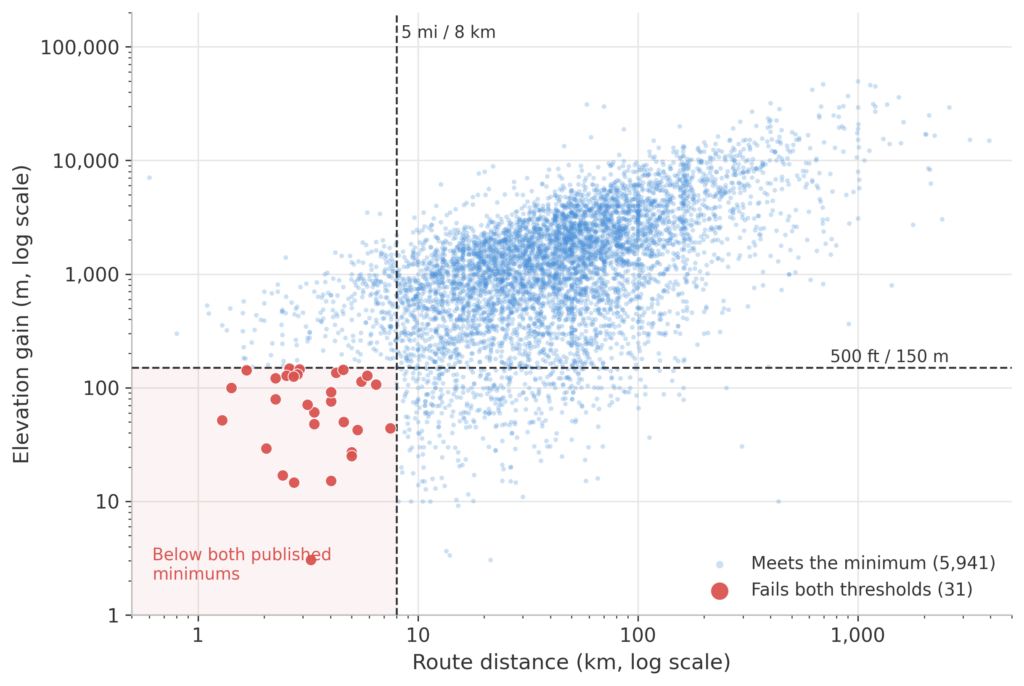
Log-log scatter plot of the 5,972 published routes that list both a distance and an elevation gain. Dashed lines mark the two published numeric thresholds (5 miles and 500 feet of gain). Thirty-one published routes fall below both thresholds. Blue points meet at least one threshold; red points meet neither. However, note that 1,253 published routes do not list a distance or an elevation gain and cannot be assessed. A few of the 31 plausibly satisfy the spirit of the rule, for instance one listing 2.7 km with 1,000 m of gain where the stated elevation looks wrong. Both facts cut the same way: the numbers on the site do not determine the outcome.
Waiting for a decision
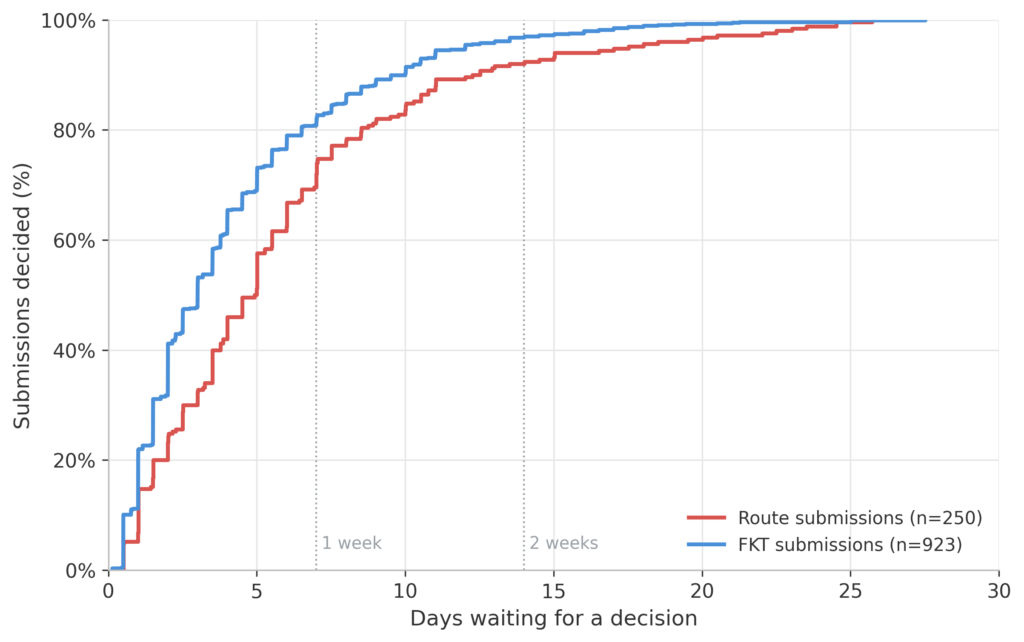
The cumulative distribution of waiting time from submission to decision, across 1,173 decisions between October 2025 and June 2026, with routes and records shown separately. Half of route submissions wait five days or more against three days for records, thirty percent wait longer than a week, and eight percent wait longer than a fortnight. For the whole of that wait there is no queue position, no estimated decision date, and no appeal if the answer turns out to be no.
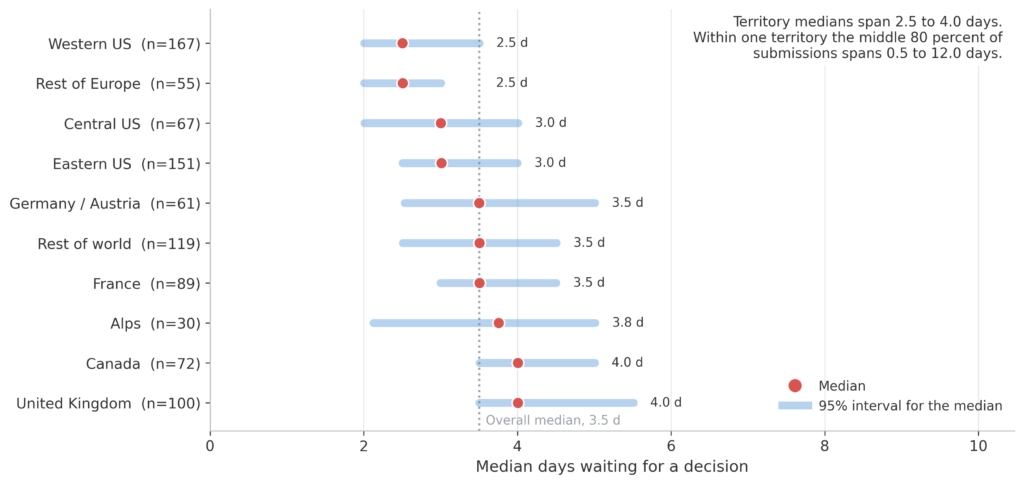
Submission decisions grouped into ten coarse reviewing territories, each with at least 25 decisions, where the red dot is the territory’s median wait and the blue bar the 95 percent interval for that median obtained by bootstrap resampling, against a dotted line at the overall median.
Route attempts
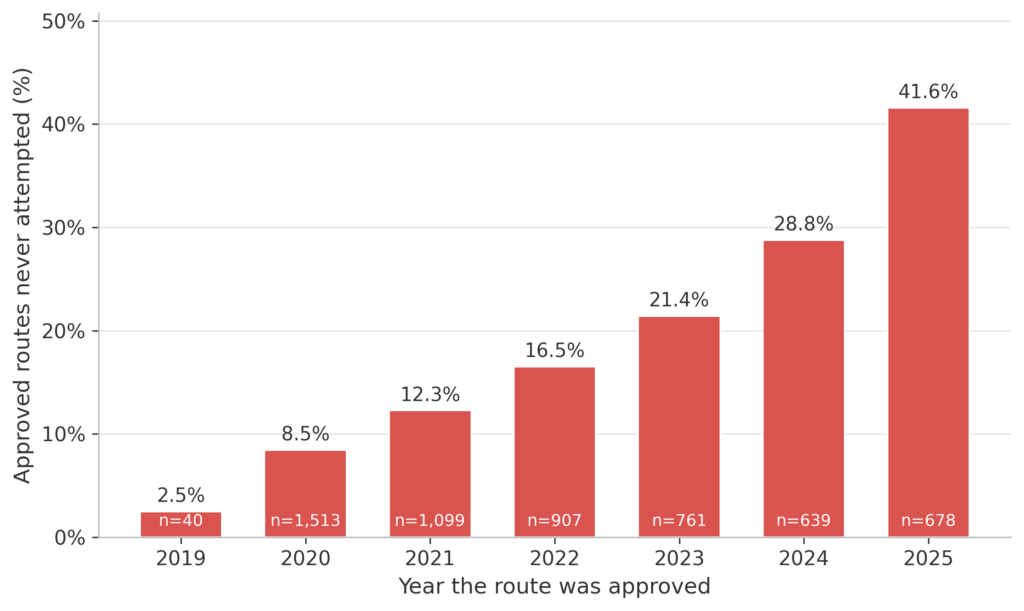
Published routes grouped by the year they were approved, showing what share of each year’s intake has no recorded attempt as of March 2026, with the sample size inside each bar. The share rises from 8.5 percent of the 2020 intake to 41.6 percent of 2025. Two in five routes approved in 2025 had still never been attempted a year later, which is a catalogue growing faster than anyone is running it. A gatekeeping process justified by protecting route quality is producing an ever larger pile of routes nobody wants, which suggests the filter is not selecting for what it claims to select for.
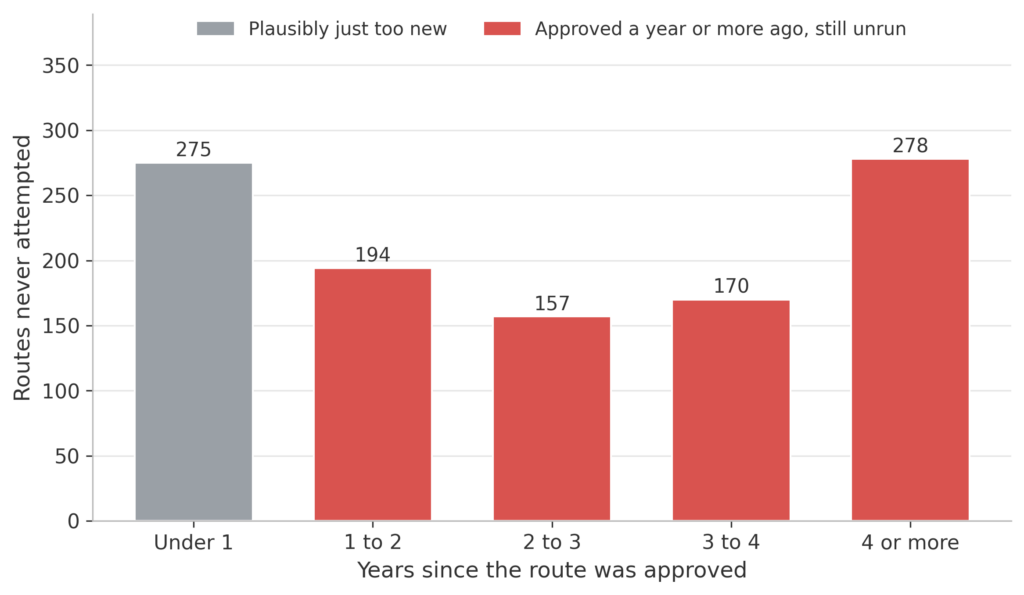
The 1,074 published routes that have no recorded attempt and a known approval date, binned by how old they are as of March 2026, with routes under a year old shown in grey because they may simply be too new. The median age is 2.5 years, 799 of the 1,074 were approved more than a year ago, and 278 have sat unrun for four years or more. The pile of unattempted routes is therefore not an artefact of recency. Every one of these routes cleared a subjective bar meant to test whether others will be interested in repeating it, and measured over four years the answer was no. A further 76 routes with no recorded attempt do not list an approval date and are excluded, and a route with no recorded attempt may still have been run without anyone filing a submission.
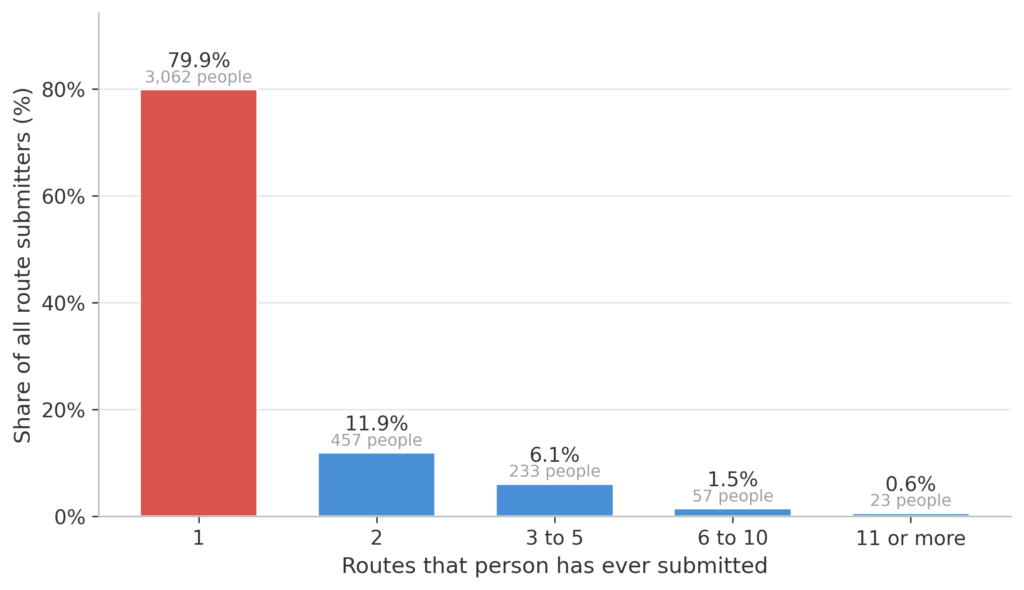
All 3,832 identifiable route submitters grouped by how many routes they have ever submitted. Four in five submitted exactly one, and the catalogue is built by 3,062 one-time contributors. The route catalogue is not the work of a prolific few, and the twenty most active submitters account for only 9.3 percent of all routes, which makes route submission one of the most broadly distributed things on the platform. That is the grassroots character worth defending, and it is also precisely the population an opaque and unappealable process fails, because a one-time submitter has no track record, no relationship with an editor, and no reason to persist after a refusal with no stated reason. A further 1,456 published routes do not name a submitter and are excluded, and submitters are matched on the username shown, so one person using two accounts is counted twice.
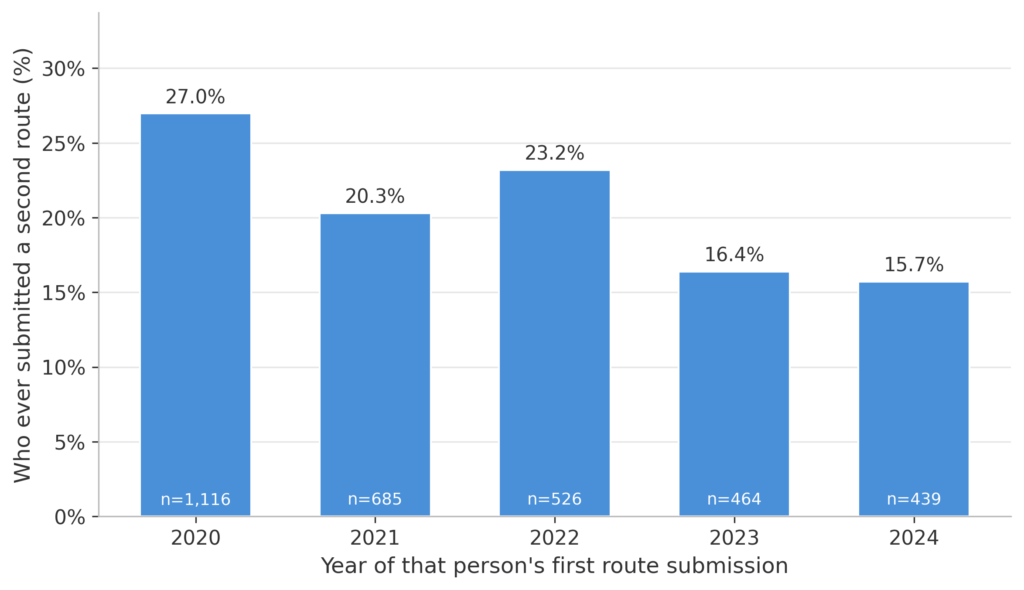
Everyone whose first recorded route submission falls in a given year, showing what fraction went on to submit at least one more.
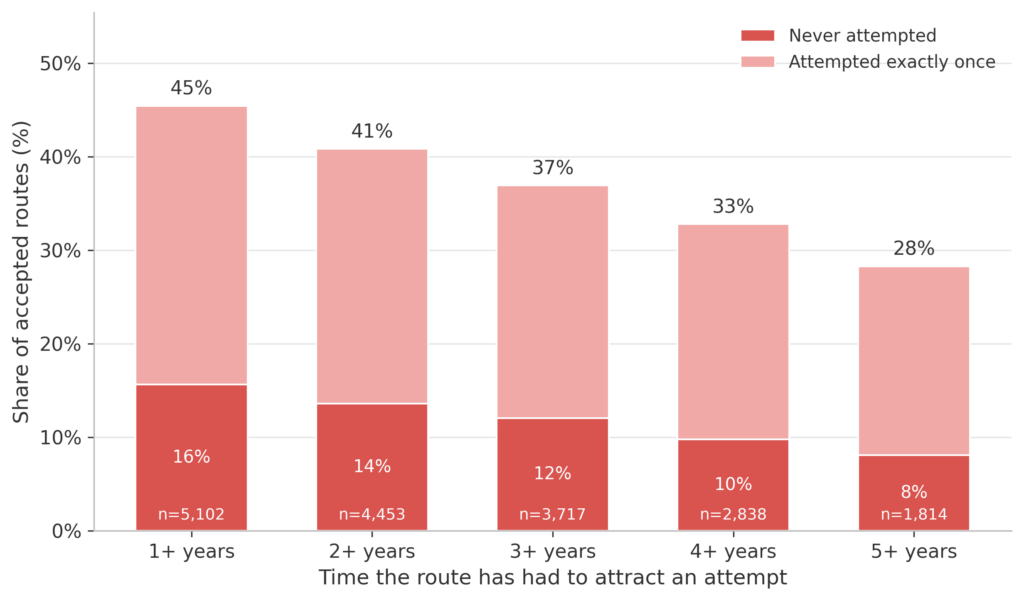
Accepted routes grouped by how long they have had to attract an attempt, showing the share never run and the share run exactly once. Among routes given five years or more, 8 percent have never been run and 28 percent have been run at most once. Nobody will do this route is a prediction, and these are the routes on which the prediction was made in the route’s favour.
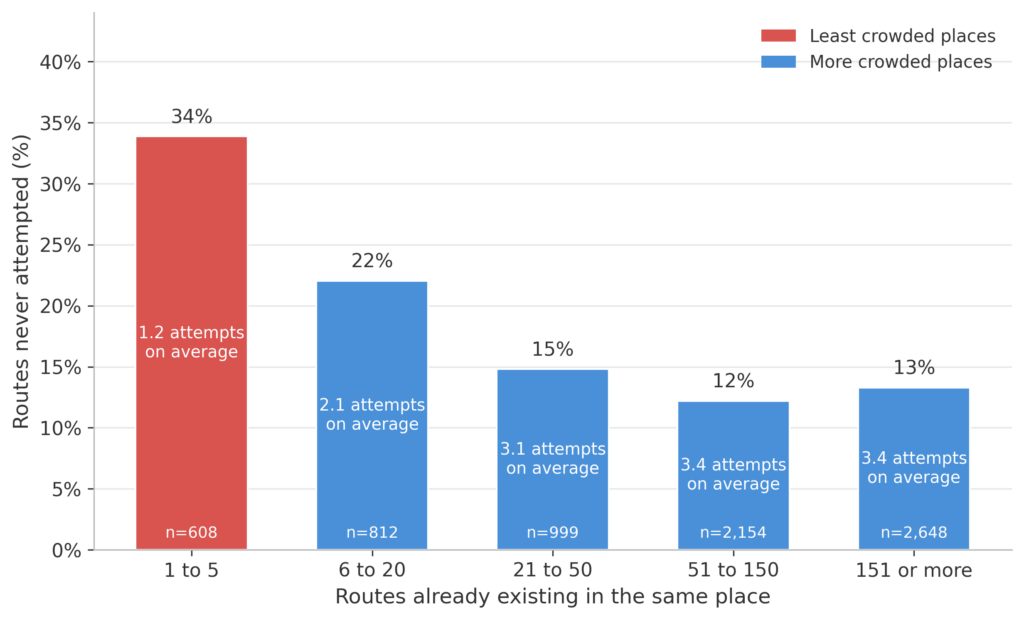
Published routes grouped by how many routes share their location, showing the share never attempted and the mean number of attempts per route. A route in a place with fewer than six routes is never attempted 34 percent of the time and draws 1.2 attempts on average, while a route in a place with more than 150 is never attempted 13 percent of the time and draws 3.4. The relationship is monotonic across the range and holds across the whole catalogue, so the overlap reason has the direction backwards. Turning a route down because the area is already covered refuses it from precisely the places where new routes get run. Crowded places are crowded because people run there, so density is standing in for local demand, and that does not rescue the stated reason so much as explain why it is wrong.
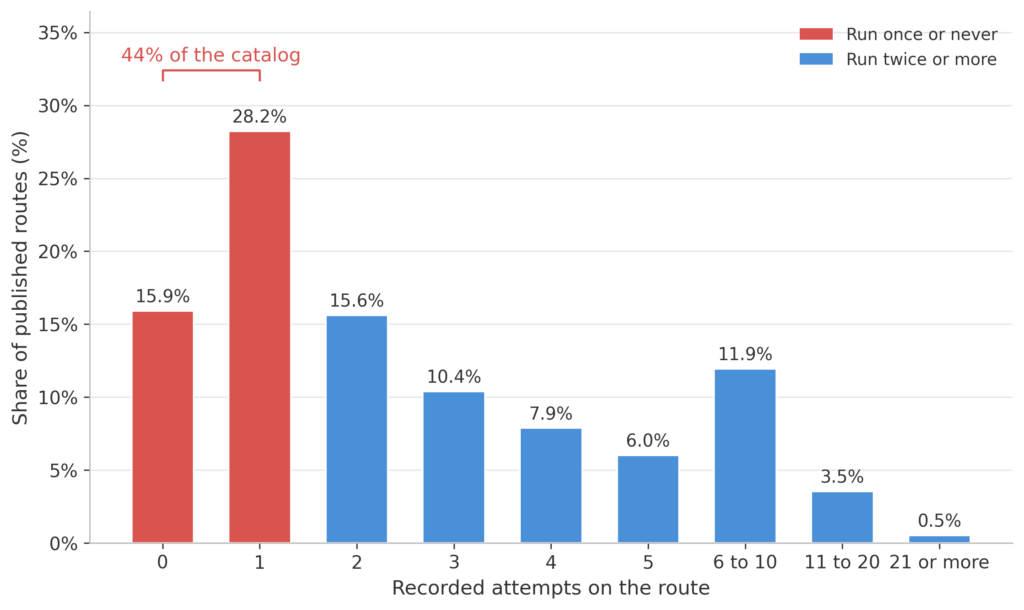
All 7,225 published routes by number of recorded attempts, with the two red bars marking routes run once or never. Those two bars are 44 percent of the catalogue: nearly a third has been run exactly once and a sixth has never been run at all. A bucket list of the best routes in the world should not be 44 percent untouched. Either the selection is not finding the best routes, or the catalogue is far larger than the standard it claims to apply. Newer routes have had less time to attract an attempt, so part of the zero bar is exposure rather than disinterest, and the prediction accuracy figure isolates the part that recency cannot explain.
Style and gender categories
No approval bias
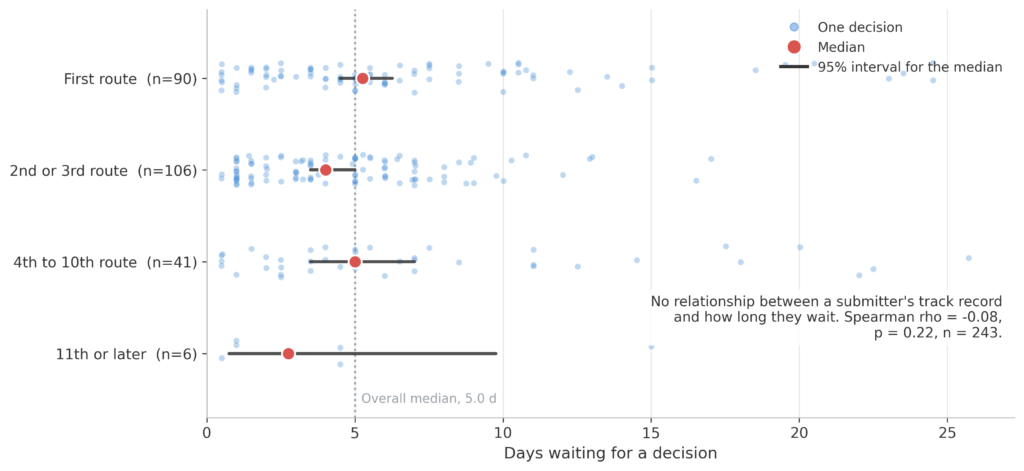
243 route decisions between October 2025 and June 2026 where the submitter is named, grouped by how many routes that person already had published at the time they submitted, with every individual decision drawn as a dot, the red marker the group median, the dark bar the 95 percent interval for that median from bootstrap resampling, and the dotted line the overall median of 5.0 days. The medians run 5.3, 4.0, 5.0 and 2.8 days in order of increasing experience, which is to say in no order at all, and the rank correlation between a submitter’s track record and how long they wait is -0.08 with a p-value of 0.22. There is no evidence here that prolific submitters are decided faster, and none that first-time submitters are made to wait longer. I looked for preferential treatment and did not find it.
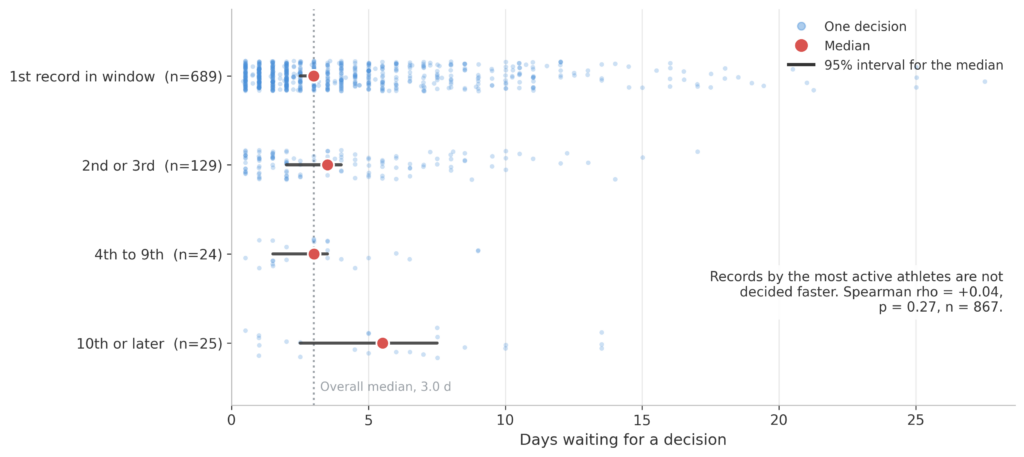
867 record decisions between October 2025 and June 2026 covering 821 athletes, grouped by how many records that athlete had already had approved within the same window, drawn the same way as the route figure with one dot per decision, the red marker the group median, the dark bar its 95 percent interval from bootstrap resampling, and the dotted line the overall median of 3.0 days. The medians run 3.0, 3.5, 3.0 and 5.5 days as activity rises, the rank correlation between an athlete’s record count and their wait is +0.04 with a p-value of 0.27, and a test across the four groups returns 0.17. Nothing here supports the idea that well-known athletes are pushed to the front of the queue. If the numbers lean at all they lean the other way, since the most active group waits longest, and that lean is not close to significant and rests on 25 decisions. Records are decided faster than routes in general, a median of 3.0 days against 5.0, which is a difference between two processes rather than between two kinds of person. Read this with the route submitter figure: both looked for favouritism by track record and both came back empty, so neither where a route is, nor who submitted it, nor how prolific the athlete is accounts for a wait that still runs from half a day to four weeks.